
Reports & dashboards
Burndown, velocity, sprint report, cumulative flow, control chart, epic and version reports, time in status, and how to build dashboards with gadgets.
Agile reports
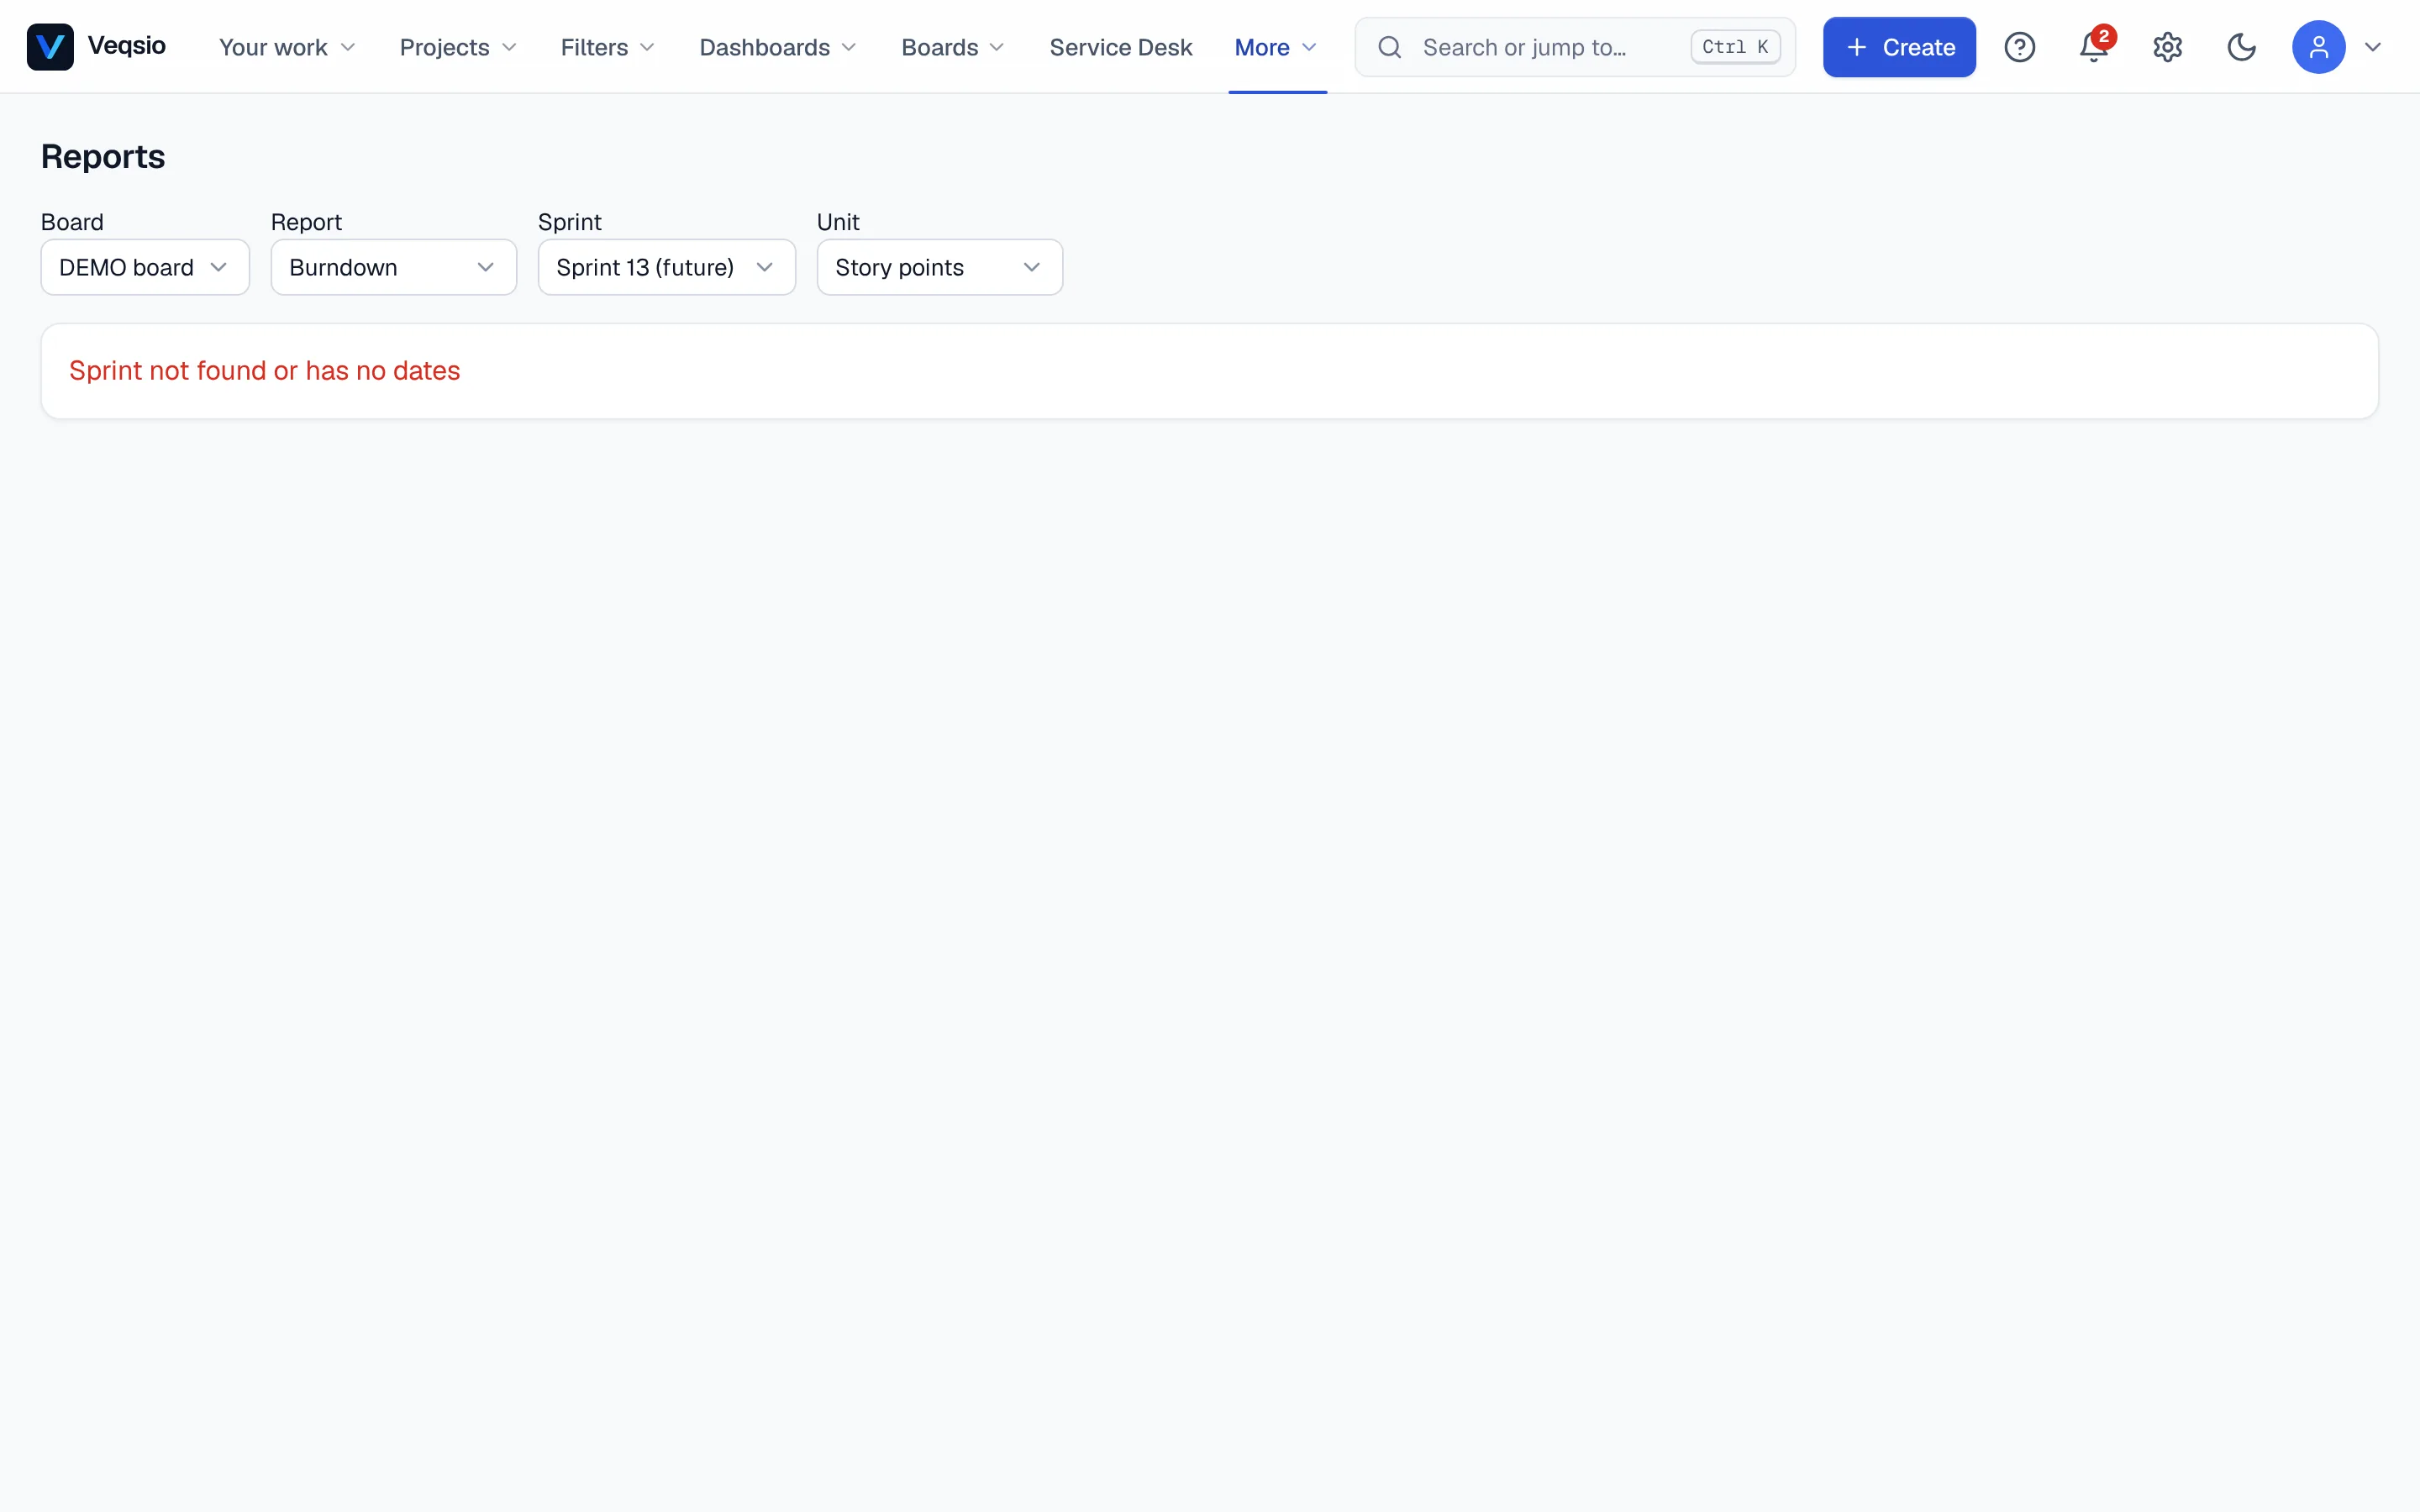
More → Reports opens the reports for a board. Choose a report type and the board or project; reports that need a sprint have a sprint picker. Where it makes sense, switch the unit between issue count, story points and hours (estimate). Cancelled work is never counted.
| Report | Answers |
|---|---|
| Burndown | Is the sprint on track? Remaining work day by day against the ideal line. |
| Velocity | How much does the team complete per sprint? Committed against completed across closed sprints, with the average velocity. Use it to size the next sprint. |
| Sprint report | What happened in one sprint: Completed, Not completed, Flagged (impediments) and Scope changes after the start. |
| Cumulative flow | How work is spread across statuses over time. Widening bands reveal bottlenecks. |
| Control chart | Cycle time and lead time per issue, for the last 7, 14, 30 or 60 days — find outliers and predict delivery. |
| Epic report / Epic burndown | Progress of an epic in issues, hours or story points. |
| Version report / Release burndown | Progress toward a release version. |
| Average time in status | How long an issue typically waits in each status, for a project, a board or a sprint. |
If the page says Create a board to see reports or No closed sprints yet, there is nothing to measure yet.
Dashboards
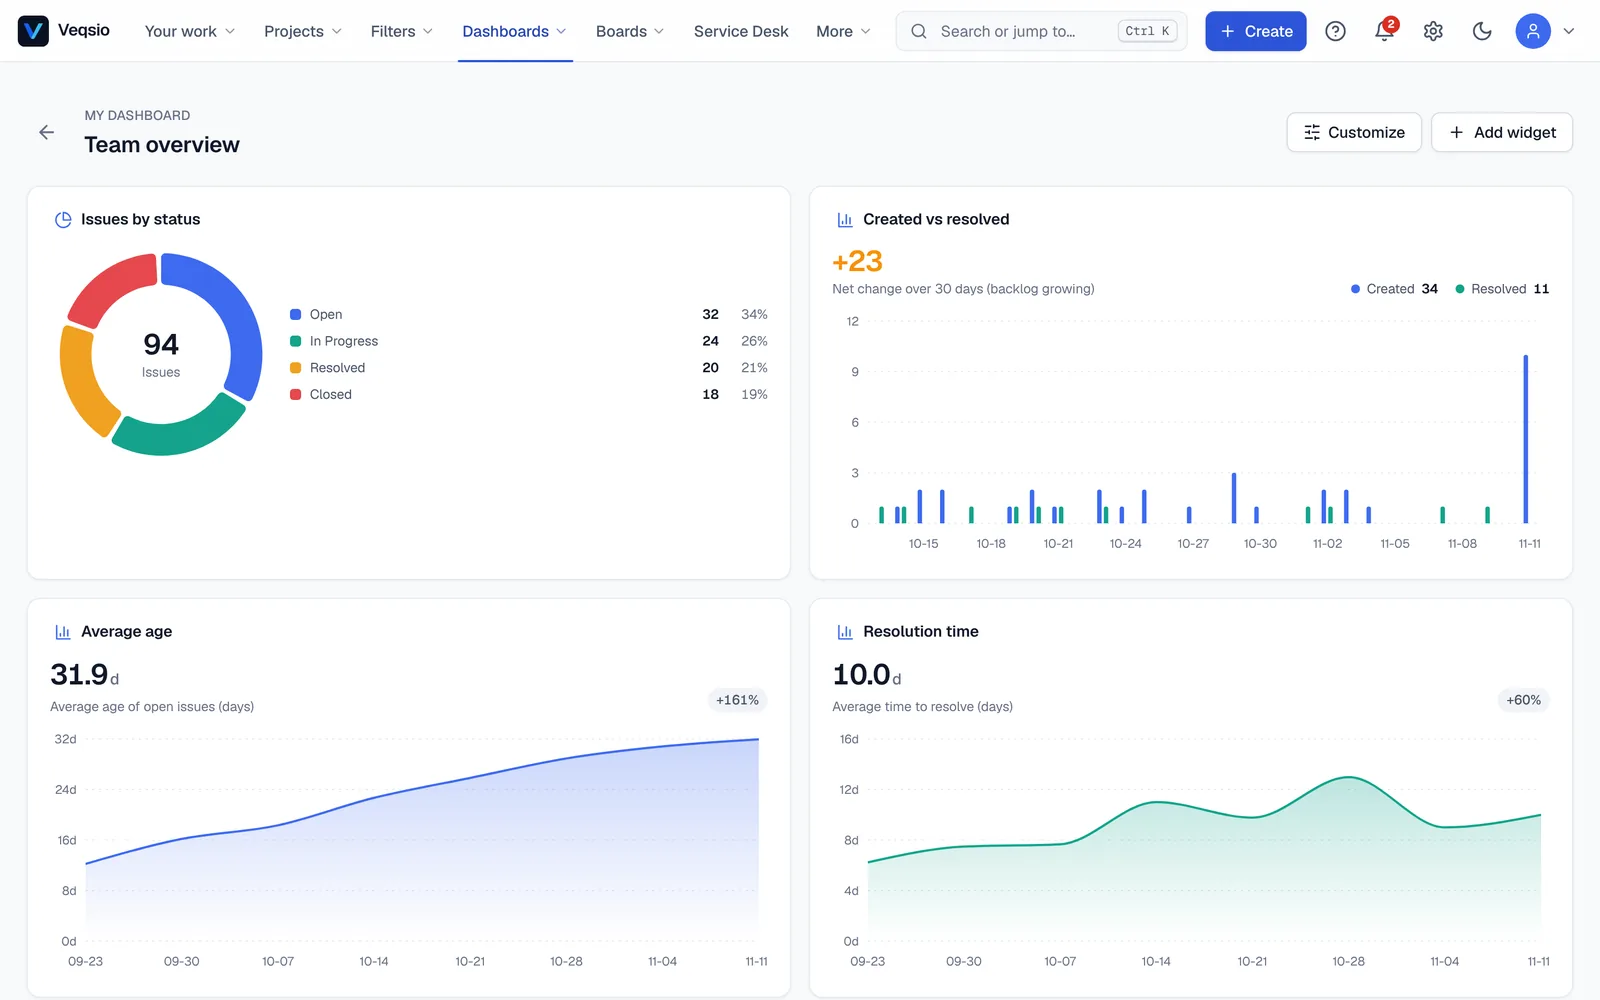
A dashboard is a page of gadgets, each showing the result of a filter or a query. Dashboards → View all dashboards lists the dashboards you can open; Your work → My dashboards is your personal workspace.
Building one
- Create a dashboard and name it.
- Add gadgets, pick each one’s type and (for most) the filter or project it reads.
- Switch to edit mode and drag gadgets to arrange them; each gadget has a settings icon for its options.
Gadget types
- Assigned to me — your open issues.
- Filter results — the issues of a saved filter as a list.
- Pie chart — a filter broken down by status, assignee, priority and so on.
- Created vs resolved — whether the team closes work as fast as it arrives.
- Average age — how old unresolved issues are, in days.
- Resolution time — days from creation to resolution.
- Sprint health — progress of the active sprint.
- Activity stream — recent changes in the projects you follow.
A gadget only shows issues the viewer is allowed to see. Dashboards can be switched off by an administrator (the menu disappears; data is kept).